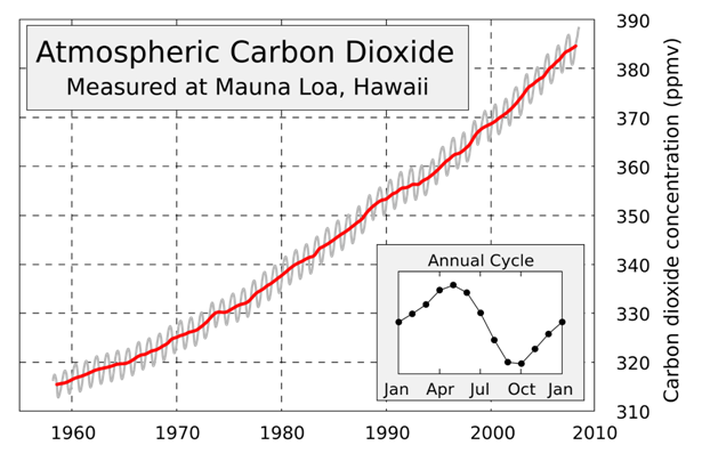
CO2 levels This graph clearly shows a picture of the rising CO2 emissions. After a couple of years you can see where it would lead.
The reason why it each year fluctuates is because there is less land located south of the equator. Most of the country lies north of the equator and also most of the vegetation. If the northern hemisphere is directed towards the sun, the leaves take in carbon dioxide and thereby reducing the level goes down in the atmosphere, and hence also on the chart. But if the North is averted give up the sun, the falling leaves off carbon dioxide which content increases in the atmosphere. It is as if the whole earth in and exhale 1x year.