|
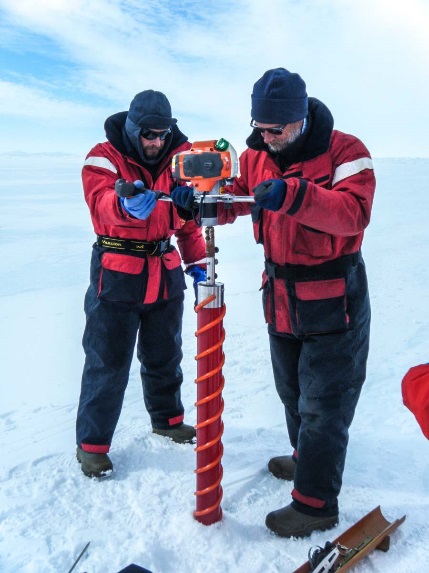
This is issued a global signal. Ice can tell us more. Lonnie Thomas takes ice samples. The ice cores they bump studied. In snowflakes are air bubbles. They can measure how much carbon dioxide contained the air when the snow fell. What I find even more interesting: serve the oxygen isotopes in which bubbles as a thermometer. So you can measure the temperature of the year that the bubble in the snow came down. And believe it or not, you can clearly see the difference when it introduced the Clean Luchtwet that year. You can read every year like rings in a tree. You can see each annual layer from the melting and freezing again. Thus, researchers and scientists go back a thousand years they have created a graph in such a glacier and it. Blue is cold, red is warm. I shows this for several reasons. First you hear skeptics sometimes say, "That's just a regular cycle. In the Middle Ages you had warming. "That's right. Which you see there. And two but compared to what is taking place now, nothing. If you're eg. Look at the temperature over a thousand years and the level of carbon dioxide, you can see the similarity.
|
|
